Since 10 years, my work and passion is all about analyzing network traffic for large Lotus Domino customers, I have detailed network and usage statistics for more than a million Notes users in my DNA data warehouse. And I maintain benchmarks to compare customers against. So I think I can judge.
From a first look and play with this 2012 calculator spreadsheet, it looks pretty complete in the sense that Microsoft have incorporated a lot of variables to represent end user behavior. Now let's see what happens if we run a couple of scenario's:
Scenario A: 10,000 users with a Medium Profile
- Leave all parameters on their initial default values in the worksheet named 'Input';
- In the worksheet named 'Client Mix', specify all users to have a Medium Profile at each site and in such a manner that every version and type of Outlook is assigned 10,000 users;
- Add a column to the right where you divide the resulting bandwidth by the number of users, thus calculating the kilobits per user: (=1024*Table47[@[Network Bandwidth )
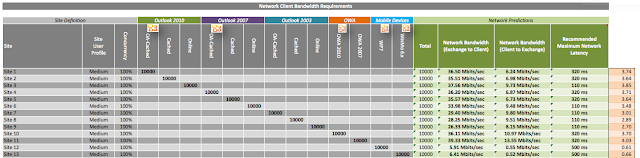 |
| Click to enlarge |
Scenario B: 10,000 users with a Very Heavy Profile
- Again leave the parameters to their initial values;
- Change the Site User Profile to 'Very Heavy';
 |
| Click to enlarge |
My observation:
Let's apply the Microsoft Recommendations to the network bandwidth requirements I reported to an organization with 9,500 users and 101 office locations world wide.
 |
| Click to enlarge |
Of the 101 office locations, Microsoft's estimations would result in a severe shortage of network capacity for 6 locations, even when applying Microsoft's most heavy profile estimates.
Would we follow Microsoft's Calculator for Medium Profiles, more than 50% of all office locations would end up with severe shortage in their network capacity. For the remaining locations, the customer would end up with significant over capacity (56% to be exact, averaged across all sites).
Why is the Microsoft Calculator giving wrong estimates for almost every site?
Do the default user profiles not represent the behavior of users at my customer properly? Do the users in my customer send and receive more messages, and are these messages perhaps smaller or larger than what Microsoft put in their profiles? I don't think that matters. Putting more load per user profile would lead to even more over capacity at half of the sites, while still leading to shortage in others.
The real problem with this calculator is putting people into profiles. You cannot predict end user behavior, you can only observe what they are doing today. It's ok to classify your observations into profiles and categories to e.g. present pretty pictures. But it is very dangerous to use those classifications and generalize entire user populations for sizing purposes.
My Conclusion:
Predicting network requirements will almost always result in either over-capacity (waste of money) or under-capacity (end users complaining about poor performance).
With DNA, we measure the Real End User Demand over a relevant 7 day period. It is far safer to expect that end users will show the same behavior tomorrow, as we observe today, than to apply an assumption that 4 or so profiles fit all your end users.
My Recommendation:
If your sole objective is to migrate away from Domino, regardless the consequences and as quickly as possible, go ahead and use Microsoft's Network Bandwidth Calculator. You'll love it.
If you prefer to make well-informed, fact based decisions with regards to your platform strategy, based on the Real End User Demand, ask IBM to perform a detailed study on the end user demand in your organization.
Side Note:
I am not an expert in Microsoft Exchange or Outlook. Although theoretically it could be possible that network consumption of outlook users is significantly lower than a typical Notes user, I doubt that this is the case.
Thank you for taking a look at this for me. I also share your experience with these types of network sizing tools. In the user guide for the tool (http://gallery.technet.microsoft.com/Exchange-Client-Network-ea5eeb02), it states:
ReplyDelete"The prediction algorithms used within this calculator are entirely new and have been derived after significant testing and observation."
I would hazard to guess that significant doesn't equate to a data warehouse of millions of client observations collected over the years.
Your initial analysis is interesting. I would like to see if you took a random sample of the 101 sites and adjust the usage patterns in the Microsoft tool to reflect the real observations. If the recommended bandwidth would reflect as expected.
On a side note, here is what I didn't like about the tool If you un-hide the tools tab, you can see that the normal distribution of the workload only has one peak mid-day. I would expect to see the normal distribution to have peeks throughout the day, or at least three (am, mid-day, late-afternoon). The second thing that isn't very clear to me is that they are only measuring network requirement between the clients and the CAS servers, and for that matter the data tables tab only reflects Total Client Traffic (Received by Client) and does not expose Total Client Traffic (Sent by Client).
I work for IBM. My opinions are my own.
I totally agree with your remark about significant testing versus the reality of a million+ end users (times 7 days of activity each).
ReplyDeleteI don't believe the normal distribution is used in the calculator, but agree that it does not reflect reality. Typically, you will see peak traffic in the morning hours (if users connect to mails servers within their time-zone of course), a dip during lunch and then another peak (lower than the morning) around 1500.
The model does include both up- and download traffic, so from client to server and vice versa.
I like your suggestion to see what happens if I take user profile data out of DNA and put that in their calculator. Will do that in the next couple of days and post the results here.